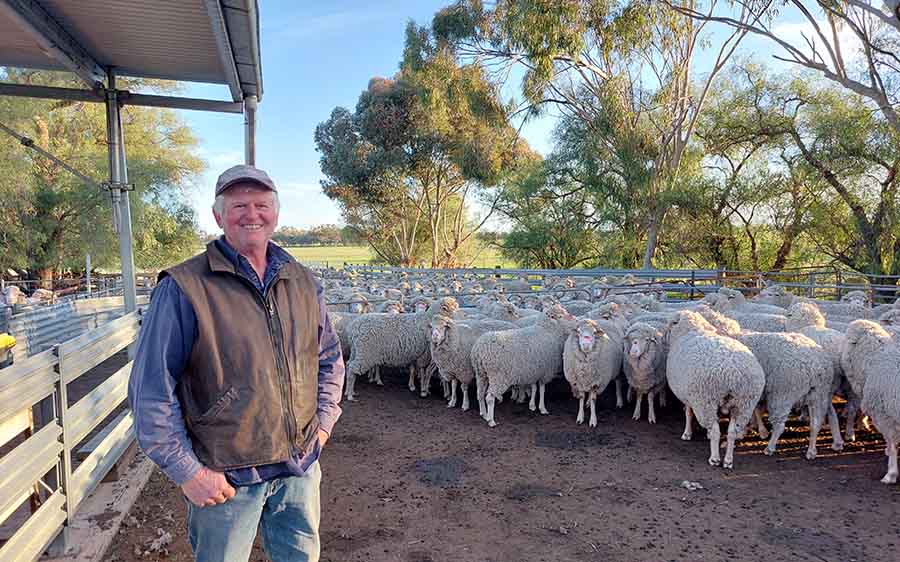
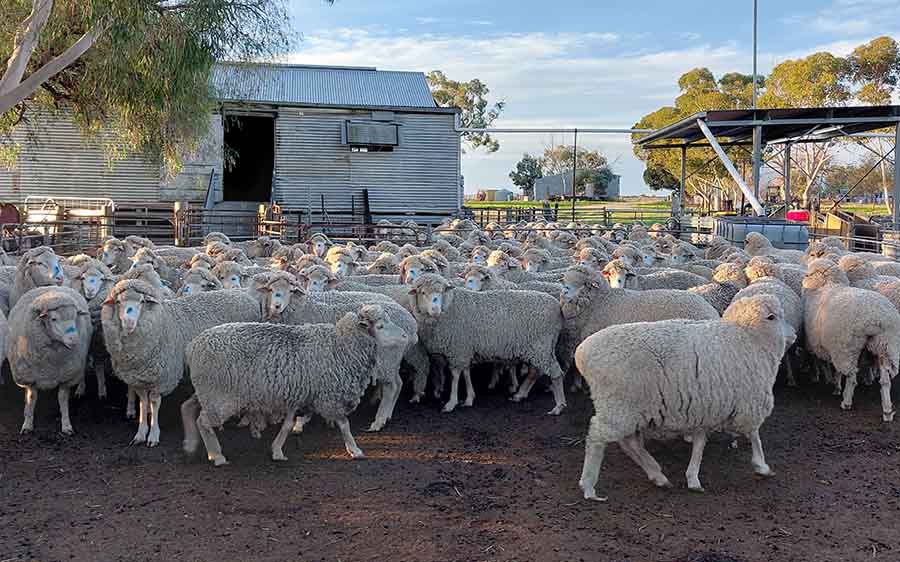
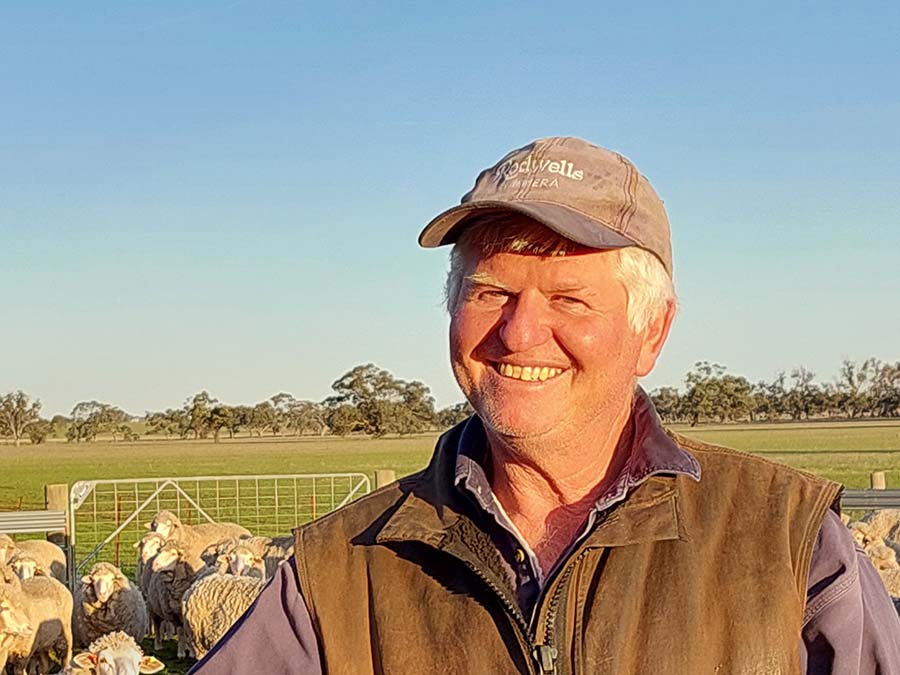
Over the past 6 years, Yarrock Farm has been on a journey towards improving the per-head profitability of its sheep flock in an effort to fare better in the face of increasingly challenging climate conditions.

From 2017, Yarrock Farm has pivoted to focusing on sheep, as this part of the enterprise was profitable at lower risk.

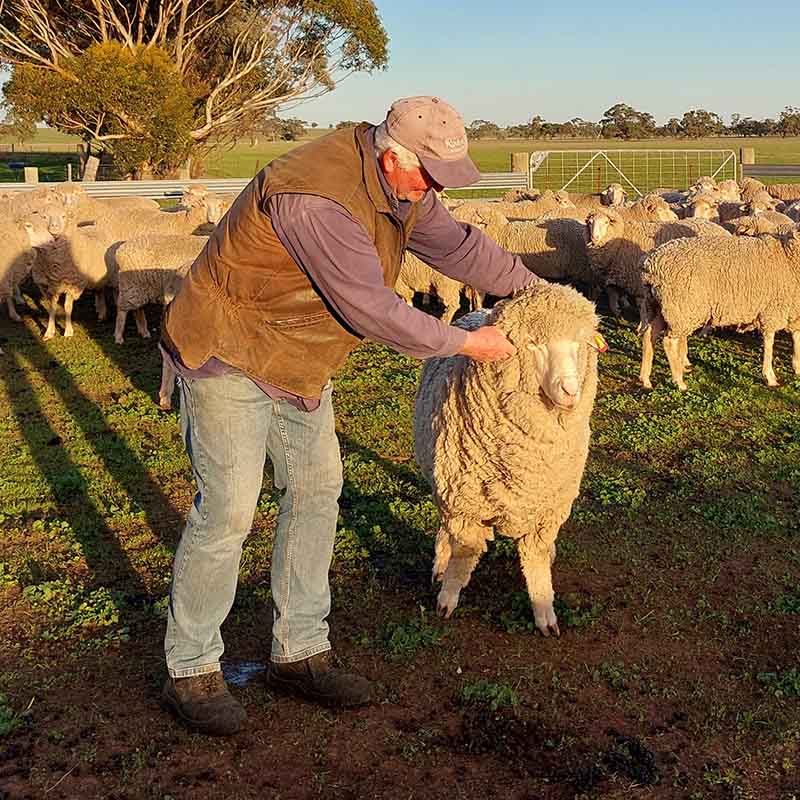
A fifth-generation farmer, Steven Hobbs has been running his cropping and sheep enterprise, Yarrock Farm, outside Kaniva for several decades. However, like many farmers, Steven noticed that seasonal conditions were becoming more erratic every year. In 2017, after several dry finishes led to less-than-ideal crop yields, Steven was keen to re-evaluate his business to move towards higher, more consistent profitability.

With the help of Graeme Hand, a holistic farm management consultant and founder of Hand for the Land, Steven developed a strategy to boost profitability in a challenging climate. Together, they found that cropping at Yarrock Farm was becoming riskier due to high costs and unpredictable yields from shorter growing seasons. Conversely, sheep were profitable at lower risk, leading to a decision to shift the cropping to sheep ratio from 60:40 to 30:70.

I had to concentrate on having more profitable animals rather than more animals, full stop.

Steven describes the shift to focusing on sheep as a 'slap in the face with a wet fish', as sheep work had never been his favourite activity. While he accepted the change for profitability's sake, he was not interested in increasing his flock size from 1,200 sheep. 'From my weather analysis, I had an understanding of what seasonal rainfall I could expect and how much grass I can grow. I didn't want to run more sheep because I knew I wouldn't be able to feed them all in a dry year,' he says. 'Instead, I wanted to reduce my numbers to match my carrying capacity but increase my profit. So I had to concentrate on having more profitable animals, rather than more animals full stop.'

Snapshot

Farm/Enterprise Name: Yarrock Farm

Farm/Enterprise Location: Kaniva, Victoria

Type of Enterprise: Sheep and cropping

Primary Markets Served: Sheep: Processors or private sales. Cropping: Export.

Staffing: 2 full-time plus contractors as needed

Property Size: 800ha

Property Elevation: 100-130mm

Average Annual Rainfall: 340mm

Climate: Mediterranean

Soil Types: Highly varied

Website: www.yarrockfarm.com

Challenge: Breeding early-maturing ewes

With the growing season reduced by 6-8 weeks, Steven wanted his maiden ewes to mature faster so they were at their optimum weight before paddock feed ran out, ready for joining in November. The focus here was on early maturity only rather than striving for physically bigger sheep. With more of his maiden ewes at ideal mature weight by joining, Steven hoped to achieve better scanning percentages.
Solution: Auto drafter use

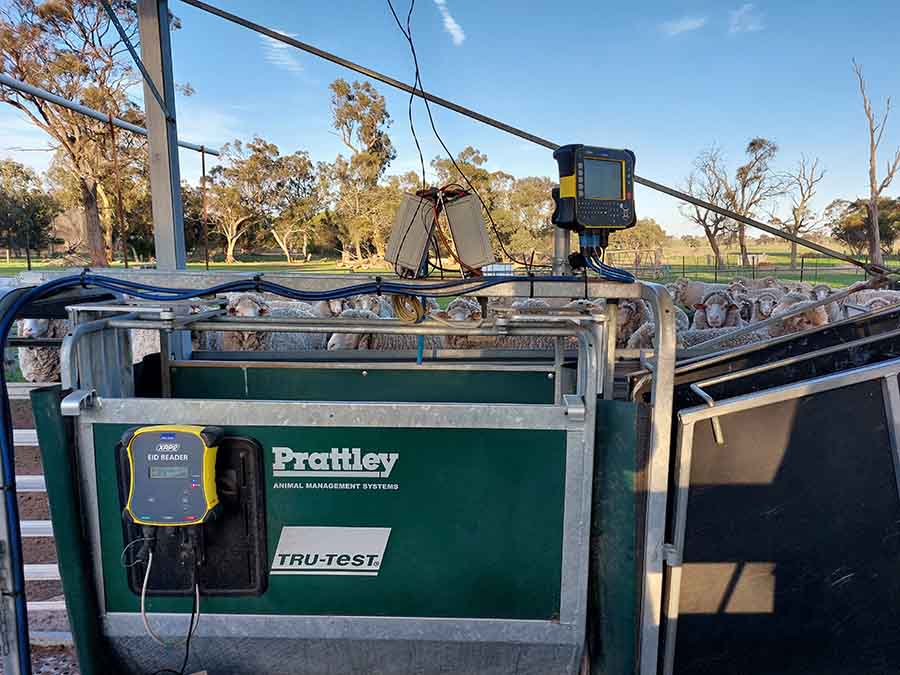
An autodrafter was purchased to assist with data collection and selection decisions.

Coincidentally, as Yarrock Farm was pivoting, the sheep eID mandate came into effect in Victoria, with many rebates on offer for eID-related equipment. Steven was successful in his application, and the $10,000 grant was used to purchase an auto drafter. From 1 January 2017, all lambs born on the property were required to have eID tags; however, Steven decided to retag his entire flock. By doing so, he was able to efficiently collect and analyse data for each ewe and use that data to make selection decisions, such as selecting for early maturing ewes.

Steven started collecting ewe weights and pregnancy statuses of his mob at scanning. He hoped to find correlations between weight range and fertility to determine the optimum joining weight for best fertility. A weight range of 65-75 kg was found to be the peak of the bell curve for both fertility and fecundity, giving Steven a number to work back from when selecting early maturing animals.

Steven weighs his maiden ewes several times throughout the year. This information is collected and allocated against each eID. The data is then analysed by external data analyst Elise Bowen from Sheep Data Management.

'When Elise presented all the data to me, it was clear to see the period when growth was happening,' Steven says. 'As a rule of thumb, we wanted sheep to be at 75% of that ideal 65-75 kg mature weight by August, and we could then put them into a rotational grazing setup to get them up to ideal weight by November.'

With the metric goals set, Steven and Elise used a formula to allocate sheep into growth deciles, allocating each ewe a number between one and 10, representative of its growth rate in comparison to the rest of the breeding flock. These deciles - recorded against the eIDs - were used to rank the ewes' growth periods and identify those maturing earlier. Using the auto drafter, Steven selects ewes in the top deciles for joining (and then runs with the rest of the self-replacing flock the following year). At the same time, excess maidens (lower-ranked deciles) are sold as young ewes in Spring. Wethers are also sold at this time before flies, lice and feed become a problem.

Outcome: Scanning and growth rates boosted

By repeatedly selecting ewes maturing 3-4 weeks earlier, ideal weights at joining time have boosted maiden scanning percentages from 80% in 2017 to 100% in 2023.

With the focus on Australian Sheep Breeding Values (ASBVs) to achieve an earlier maturing flock, wether growth rates have also steadily improved. The average Merino wether lamb weight at sale time in 2022 was 9.7 kg heavier than in 2018. 'Everyone talks about sire growth rates, but lambs get half the genetic gain from their mothers as well,' Steven says. 'It is important to breed ewes with good growth rates. If we discounted the genetic gain from our ewes, we would need our sires to be plus 20 kg of weight by ASBVs to get 10 kg extra in the lambs, and that's not what's happening here.'

The overall scanning percentage of the entire flock (maidens included) jumped from 80% in 2017 to 125% in 2023.

Steven also used his knowledge of optimal joining weight when preparing the rest of his flock for joining in the rotational grazing setup. The overall scanning percentage of the entire flock (maidens included) jumped from 80% in 2017 to 125% in 2023.

Further, having the whole flock in the weight range corresponding to optimum fertility means Yarrock Farm has eliminated the need for additional fertility treatments to improve reproductive performance. 'Regulin is a good product, but if I know my sheep are all going to cycle anyway, I don't need to use it, and I can save $8 per ewe,' Steven says.
Challenge: Optimising the flock

Like his commitment to selecting his best maiden ewes as self-replacements, Steven wanted to ensure he made good decisions in other areas, making his flock as profitable as possible.

Solution: GxExM refinement

Step 1: Sire selection

To maximise his flock's profitability, Steven needed to identify the most profitable aspects of his sheep enterprise and use this data to inform his sire selection. He found that wool generated only 16% of his income, leading him to avoid focusing on fleece measurements when selecting rams at stud sales and instead prioritise positive ASBVs for fat depth. 'My focus is fertility and growth rate, but I'm getting a free ride with wool, as every ram breeder is wanting to breed more wool as part of producing good dual-purpose rams,' Steven says. 'I buy rams with greasy fleece weight percentages between 90-95%. They won't be the top rams in the catalogue, as everyone is after the higher wool cutters, but they will be the top rams for me.'

Step 2: Tweaking environment and management

With genetics fine-tuned for a quicker-growing, highly fertile flock, Steven then optimised lambing paddock conditions to minimise ewe and lamb mortalities. By examining the physical aspects of paddocks with strong marking percentages (up to 171% in one paddock), it was possible to identify the features that likely contributed to those high percentages. Where possible, Steven implemented environmental and management changes in other paddocks to ensure conditions were as favourable as possible. These changes included:

  • creating shelter belts where needed, with eastern-facing aspects allowing sheep and lambs to bask in the morning sun and warm up quickly after cold nights
  • electrifying the boundaries of lambing paddocks to combat fox and wild dog problems
  • lambing in separate mobs based on joining sire (to determine individual sire performance by looking at growth rates of its lambs, down the track), and pregnancy status (singles and multiples), and feeding accordingly based on number of lambs on board.
  • fine-tuning stocking rate for optimum lamb survival to 7-9 DSE.

Outcome: Key metrics boosted

Steven's lamb marking percentage in 2017 was 85% across his entire flock. That number is now anywhere between 125-130% due to consistently good genetic, environmental and management decisions made over the years. With such an improvement in marking percentages, Steven is seeing more lambs on the ground each year compared to before 2017, even though he has dropped his flock size from 1,200 mature ewes down to 800 to match the expected carrying capacity.

And while focusing on wool hasn't been a priority in recent years, Steven is seeing an improvement in wool measurements across the board. Flock micron has dropped from 23 microns to 21 microns, while staple length has increased by 10%. 'I'm cutting more wool per sheep without actually focusing on wool, just because breeders are focusing on those things in their genetics,' Steven says. 'And fault wools are generally from the lower profit ewes, so by removing those ewes, my fault wools have almost completely disappeared.'

Challenge: Identifying high performers

Steven needed a data-driven way to 'rank his breeding ewes, as a visual assessment of the flock did little to identify the most profitable animals.

An improvement in overall flock productivity has been a major win for Steven; however, whenever he wanted to reduce numbers due to tough seasonal conditions or a falling market, he lacked a logical process to determine which animals to retain and which to sell.

A visual assessment of the flock is not effective for identifying the major breadwinners, so Steven needed a data-driven way to 'rank' his breeding ewes from most to least profitable to guide his selection decisions.

Solution: League table creation

To identify which animals were the high performers in the flock, he created a league table spreadsheet to determine the income generated by each ewe each calendar year. Specifically, the table includes year-by-year data on lamb and wool income generated from each ewe, calculated as below.

Lamb: While specific lambs cannot be allocated to a specific ewe, Steven can approximately determine how many lambs each ewe has raised. First, he conducts udder assessments of ewes post-marking to determine which animals raised a lamb. Anything with a dry udder is allocated a lamb dollar value of zero. To determine the lamb value of wet ewes, the total number of wet ewes is divided by the number of lambs marked in that mob. Later, this number is multiplied by the lamb price received to determine the lamb income generated per ewe, with this number entered into the league table against the corresponding eID.

Wool: This is calculated by collecting fleece weights at shearing time. Once each fleece is shorn, the sheep's eID tag is scanned using an eID wand. Indicator scales are then used to weigh the fleece and log the value next to the corresponding eID; the fleece is then thrown onto the table. 'Using the wand doesn't create a headache or slow anything down,' Steven says. 'The shearers are happy to cooperate, enabling me to collect data, which helps me to allocate income to individual animals.' Later, when bales are sold, the fleece weight for each ewe is multiplied by the wool price received. That figure is then added to the league table against the corresponding eID.

Despite the large number of values in the league table, data gathering from eID readers and Excel spreadsheet formulas make data entry and value calculations straightforward.

The league table also includes a rolling average dollar figure for income each ewe generates over its lifetime. New data each year leads to constant updates of this average. A decile value is then assigned for each ewe based on the rolling average figure.

Despite the large number of values in the league table, data gathering from eID readers and Excel spreadsheet formulas make data entry and value calculations straightforward.

Outcome: Straightforward decision-making

Steven can check the league table at any time to see which ewes are most profitable. If he needs to reduce breeding stock numbers, he can select based on income. 'If times get tough, and you need to sell down your ewes to match carrying capacity based on feed you've got on hand, it's a really simple choice as to which animals to keep,' he says. 'And by keeping the best animals, you then recover faster at the other end.'

Thanks to the auto drafter, the practicalities of retaining top-performing animals are straightforward. A quick call to the livestock agent gives Steven the current selling price for breeding ewes, and the auto drafter is programmed to draft ewes based on whether their average income generated is higher or lower than this price. Ewes below this price are sold, with carrying capacity determining the absolute number to be sold. 'It sounds like a cutthroat system, but because that average figure is a rolling average over an animal's entire lifetime, it allows for leniency if a ewe underperforms one year but bounces back the next,' Steven says.

'If times get tough, and you need to sell down your ewes to match carrying capacity based on feed you've got on hand, it's a really simple choice as to which animals to keep.'

As old ewes are sold and maiden ewes are introduced into the flock each year, the dollar spread between top and bottom ewes remains constant. However, by persistently selecting and retaining ewes that are performing at or above the average dollar return, Steven has increased the percentage of ewes that are generating income above the average. In 2018, 41% of the flock ewes were at or above the average, while in 2023, that figure now stands at 53%, meaning that overall flock profitability continues to travel on an upward trajectory.

Conclusion

Steven is happy with the progress made since 2017.

The past 6 years have been a huge period of change at Yarrock Farm. Many changes have involved a deep dive into data analysis. Yet, Steven has used external help where needed to simplify the process. External data analyst Elise Bowen has played a big role, and tools such as the free CIBO Labs Total Standing Dry Matter feedbase monitor, available through the MLA website, have also helped make the process more straightforward.

'I'm getting better at data analysis, but there are people out there to help, which was especially important when I was just starting out,' Steven says. 'You don't have to do it all yourself, and you don't need to do everything all at once.'

The auto drafter itself - the key piece to the selection puzzle - was cheaper than a second-hand ute, and due to the productivity and profitability gains it contributed to, it paid itself off in the first 2 years.

'I actually don't mind sheep now,' Steven says. 'I used to say I really like sheep... especially with mashed potatoes and peas, but now my attitude is a little more sophisticated. They're money makers for me.'